RISC-V from scratch 2: Hardware layouts, linker scripts, and C runtimes
- Introduction
- Setup
- The naive approach
- Lifting the
-veil - Finding our stack
- Link it up
- Stop!
HammertimeRuntime! - Debugging, but for real this time
- What’s next
- Extra credit
Introduction
Welcome to the second post in the RISC-V from scratch series! As a quick recap, throughout RISC-V from scratch we will explore various low-level concepts (compilation and linking, primitive runtimes, assembly, and more), typically through the lens of RISC-V and its ecosystem. In the first post of this series, we introduced RISC-V, explained why it’s important, set up the full GNU RISC-V toolchain, and built and ran a simple program on an emulated version of a RISC-V processor with the help of SiFive’s freedom-e-sdk.
The freedom-e-sdk made it trivial for us to compile, debug, and run any C program on an emulated or physical RISC-V processor. We didn’t have to worry about setting up any linker scripts or writing a runtime that sets up our stack, calls into main, and more. This is great if you’re looking to quickly become productive, but these details are exactly the sort of thing we want to learn about!
In this post, we’ll break free from the freedom-e-sdk. We’ll write and attempt to debug a simple C program of our own, unveil the magic hidden behind main, and examine the hardware layout of a qemu virtual machine. We’ll then examine and modify a linker script, write our own C runtime to get our program set up and running, and finally invoke GDB and step through our program.
Setup
If you missed the previous post in this series and don’t have riscv-qemu and the RISC-V toolchain installed and were hoping to follow along, jump to the “QEMU and RISC-V toolchain setup” section (or in RISC-V assembly, jal x0, qemu_and_toolchain_setup) and complete that before moving on.
Next, let’s set up a workspace for the code we will write today (and in future posts).
git clone git@github.com:twilco/riscv-from-scratch.git
# or `git clone https://github.com/twilco/riscv-from-scratch.git` to clone
# via HTTPS rather than SSH
# alternatively, if you are a GitHub user, you can fork this repo.
# https://help.github.com/en/articles/fork-a-repo
cd riscv-from-scratch/work
As the name suggests, the work directory will serve as our working directory for this and future posts.
The naive approach
Let’s start our journey by using the text editor of your choice to create a simple C program called add.c that infinitely adds two numbers together.
// file: riscv-from-scratch/work/add.c

int main() {
    int a = 4;
    int b = 12;
    while (1) {
        int c = a + b;
    }
    return 0;
}
We want to run this program, and the first step on that path is compiling it into something executable by our RISC-V CPU.
# -O0 to disable all optimizations. Without this, GCC might optimize
# away our infinite addition since the result 'c' is never used.
# -g to tell GCC to preserve debug info in our executable.
riscv64-unknown-elf-gcc add.c -O0 -g
This produces a file called a.out, which is the default name gcc gives executables when we don’t tell it what we want them to be called. We can now run this brand new executable inside qemu:
# -machine tells QEMU which among our list of available machines we want to
# run our executable against.  Run qemu-system-riscv64 -machine help to list
# all available machines.
# -m is the amount of memory to allocate to our virtual machine.
# -gdb tcp::1234 tells QEMU to also start a GDB server on localhost:1234 where
# TCP is the means of communication.
# -kernel tells QEMU what we're looking to run, even if our executable isn't
# exactly a "kernel".
qemu-system-riscv64 -machine virt -m 128M -gdb tcp::1234 -kernel a.out
We’ve chosen the virt RISC-V machine, which is one riscv-qemu comes with out of the box.
Now that our program is running inside QEMU with a GDB server on host localhost and port 1234, let’s connect to it with our RISC-V GDB client from a separate terminal:
# --tui gives us a (t)extual (ui) for our GDB session.
# While we can start GDB without any arguments, specifying 'a.out' tells GDB
# to load debug symbols from that file for the newly created session.
riscv64-unknown-elf-gdb --tui a.out
And we should now find ourselves inside GDB!
This GDB was configured as "--host=x86_64-apple-darwin17.7.0 --target=riscv64-unknown-elf".           │
Type "show configuration" for configuration details.                                                  │
For bug reporting instructions, please see:                                                           │
<http://www.gnu.org/software/gdb/bugs/>.                                                              │
Find the GDB manual and other documentation resources online at:                                      │
    <http://www.gnu.org/software/gdb/documentation/>.                                                 │
                                                                                                      │
For help, type "help".                                                                                │
Type "apropos word" to search for commands related to "word"...                                       │
Reading symbols from a.out...                                                                         │
(gdb)
While we could now try to tell GDB to run or start the a.out executable it’s currently pointed at, this won’t work, and for good reason. We used riscv64-unknown-elf-gcc to compile our program, so unless our host machine is running a riscv64 CPU it won’t know what to do with a program compiled for that target.
All is lost, right? Of course not! This situation is one major reason for GDB’s client-server model. We can take our riscv64-unknown-elf-gdb executable which knows how to debug riscv64 targets and point it at some remote target (a GDB server) instead of running the program on our host machine. As you may recall, we just started riscv-qemu and told it to start a GDB server on host localhost and port 1234. Connecting to this server is as easy this:
(gdb) target remote :1234                                                                             │
Remote debugging using :1234
And now we should be able to set some breakpoints:
(gdb) b main
Breakpoint 1 at 0x1018e: file add.c, line 2.
(gdb) b 5 # this is the line within the forever-while loop. int c = a + b;
Breakpoint 2 at 0x1019a: file add.c, line 5.
And finally tell GDB to continue with shorthand c until we hit a breakpoint:
(gdb) c
        Continuing.
You’ll quickly notice that we just keep continuing, and continuing, and continuing…shouldn’t we hit our b 5 breakpoint instantly, since we’re simply looping indefinitely on that line? What’s going wrong?
Let’s take a look at our interface, which for me looked like:
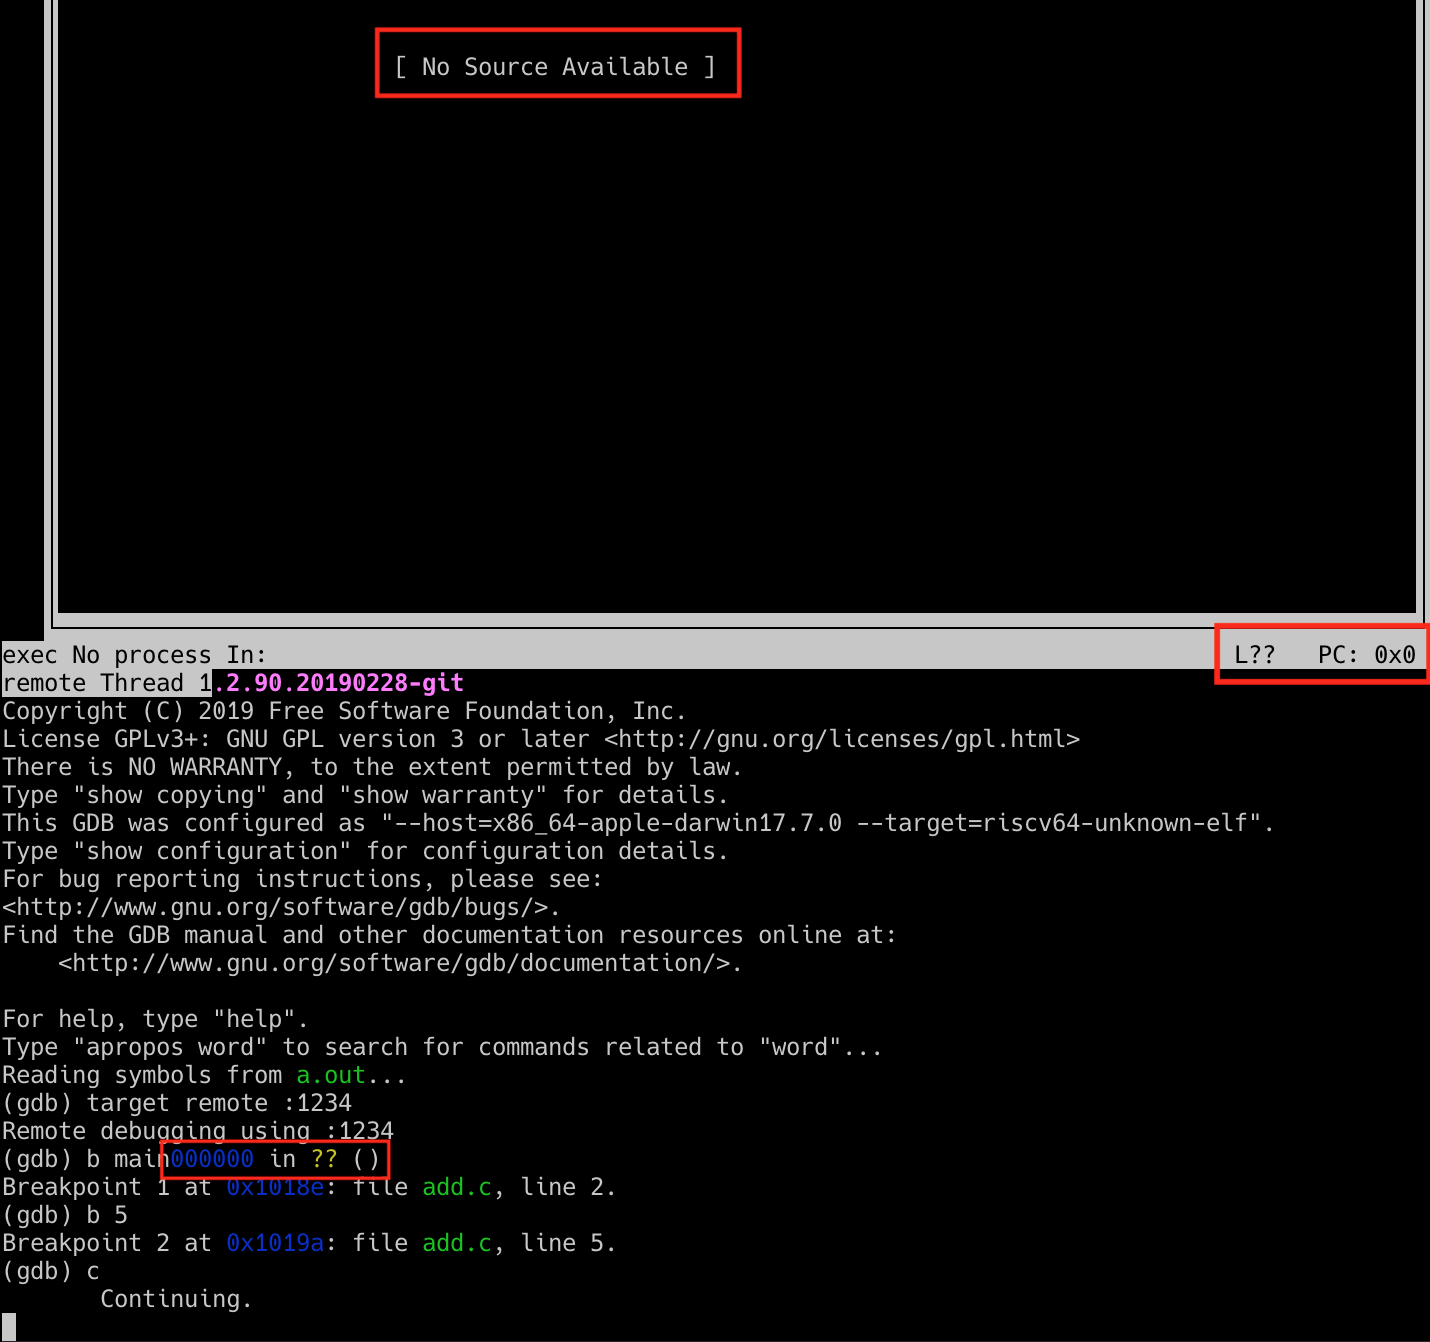
There are several red flags here:
- GDB’s TUI is unable to find a source. This should be displaying our code and any nearby breakpoints.
- GDB doesn’t know the current line of execution (
L??), and lists a program counter of 0x0 (PC: 0x0). - Some clobbered text in our prompt area that looks like this in its full form:
0x0000000000000000 in ?? ()
These indicators, in combination with the fact that we never hit a breakpoint, signals we have done something wrong. But what is it?
Lifting the -veil
To figure out what’s going on here, we need to take a detour and talk about how our simple C program actually works underneath the surface. We have a function called main that does our simple addition, but what is main, really? Why must it be called main and not origin, or begin, or entry? Conventionally we know that all executables start running at main, but what magic occurs to make this happen?
To answer these questions, let’s re-run our GCC command with the -v flag to get a more verbose output of what it is actually doing.
# In the `riscv-from-scratch/work` directory...
riscv64-unknown-elf-gcc add.c -O0 -g -v
There’s quite a lot we get back so we won’t look through it all. The first important thing of note is that even though GCC stands for “GNU C Compiler”, gcc also by default links our code in addition to compiling and assembling it (-c tells GCC only to compile and assemble). Why is this relevant? Well, take a look at this snippet pulled from our verbose gcc command:
# The actual `gcc -v` command outputs full paths, but those are quite
# long, so pretend these variables exist.
# $RV_GCC_BIN_PATH = /Users/twilcock/usys/riscv/riscv64-unknown-elf-gcc-<date>-<version>/bin/
# $RV_GCC_LIB_PATH = $RV_GCC_BIN_PATH/../lib/gcc/riscv64-unknown-elf/8.2.0

$RV_GCC_BIN_PATH/../libexec/gcc/riscv64-unknown-elf/8.2.0/collect2 \
  ...truncated...
  $RV_GCC_LIB_PATH/../../../../riscv64-unknown-elf/lib/rv64imafdc/lp64d/crt0.o \
  $RV_GCC_LIB_PATH/riscv64-unknown-elf/8.2.0/rv64imafdc/lp64d/crtbegin.o \
  -lgcc --start-group -lc -lgloss --end-group -lgcc \
  $RV_GCC_LIB_PATH/rv64imafdc/lp64d/crtend.o
  ...truncated...
COLLECT_GCC_OPTIONS='-O0' '-g' '-v' '-march=rv64imafdc' '-mabi=lp64d'
I realize that even in a shortened form this is still a lot to look at, so let me explain what’s going on here. On our first line, gcc is executing a program called collect2, passing along arguments such as crt0.o, crtbegin.o, and crtend.o, and flags like -lgcc and --start-group. We can read about what collect2 is here - in short, collect2 arranges various initialization functions at start time by making one or more linking passes.
Knowing this, we see that GCC is linking multiple different crt object files with the code we wrote. As you might guess, crt stands for “C runtime”. You can read in detail what each crt is for here, but in our case we care the most about crt0, which has one very important job:
This object [crt0] is expected to contain the
_startsymbol, which takes care of bootstrapping the initial execution of the program.
What exactly this bootstrapping of initial execution is depends on the platform in question, but generally it includes important tasks such as setting up the stack frame, passing along command line arguments, and calling into main. Yes, we have finally answered the question posed at the beginning of this section - it is _start who calls into our main function!
Finding our stack
We’ve solved one mystery, but you might be wondering how this gets us any closer to our original goal of being able to step through our simple C program with gdb. There are a few problems we have left to address, but the first we have has to do with the way crt0 is setting up our stack.
As we saw above, gcc links a default crt0 unless told to do otherwise. This default crt0 is selected based on several factors, namely:
- Target triplet, which follows the structure of
machine-vendor-operatingsystem. For us, this isriscv64-unknown-elf - Target ISA,
rv64imafdc - Target ABI,
lp64d
This may work fine in a general case, but is undoubtedly not going to work for every RISC-V processor. As mentioned previously, one of crt0s jobs is to set up the stack, but how can it do that if it doesn’t know where the stack should be for the CPU (-machine) we’re running against? Answer: it can’t, at least not without us giving it a bit of assistance.
Circling back to the qemu command we ran at the beginning of this post (qemu-system-riscv64 -machine virt -m 128M -gdb tcp::1234 -kernel a.out), recall we were using the virt machine. Fortunately for us, qemu exposes a simple way to dump information about a machine in dtb (devicetree blob) format.
# In the `riscv-from-scratch/work` directory...

# Use qemu to dump info about the 'virt' machine in dtb (devicetree blob)
# format.
# The data in this file represents hardware components of a given
# machine / device / board.
qemu-system-riscv64 -machine virt -machine dumpdtb=riscv64-virt.dtb
Data in dtb format is difficult to read considering it’s mostly binary, but there is a command-line tool called dtc (devicetree compiler) that can convert it into something more human-readable.
# I'm running MacOS, so I use Homebrew to install this. If you're
# running another OS you may need to do something else.
brew install dtc
# Convert our .dtb into a human-readable .dts (devicetree source) file.
dtc -I dtb -O dts -o riscv64-virt.dts riscv64-virt.dtb
This gives us a file called riscv64-virt.dts, which has lots of interesting information about virt such as the number of available CPU cores, the memory location of various peripherals such as the UART, and the memory location of the onboard memory (RAM). We want our stack to live inside this memory, so let’s grep for it:
grep memory riscv64-virt.dts -A 3
        memory@80000000 {
                device_type = "memory";
                reg = <0x00 0x80000000 0x00 0x8000000>;
        };
We see that the device_type for this node is “memory”, which means we’ve probably found what we’re looking for. Using the values inside reg = <...>;, we can also determine where this memory bank starts and how long it is.
Referencing the devicetree specification, we see that the syntax for reg is an arbitrary number of (base_address, length) pairs. However, there are four values inside reg - shouldn’t there only be two necessary to define our singular memory bank?
Again referencing the devicetree specification (search for “Property name: reg”), we learn that the number of <u32> cells required to specify the address and length is determined by the #address-cells and #size-cells properties in the parent of node (or in the node itself). These values aren’t specified in our memory node, and the parent of the memory node is simply the root portion of the file, so let’s look there for these values:
head -n8 riscv64-virt.dts
/dts-v1/;

/ {
        #address-cells = <0x02>;
        #size-cells = <0x02>;
        compatible = "riscv-virtio";
        model = "riscv-virtio,qemu";
And there we have it - it takes two 32-bit values (cells) to specify an address, and two 32-bit values to specify length. This means, given reg = <0x00 0x80000000 0x00 0x8000000>;, our memory begins at 0x00 + 0x80000000 (0x80000000) and extends 0x00 + 0x8000000 (0x8000000) bytes, meaning it ends at 0x88000000. In more human-friendly terms, we can use a hexadecimal calculator to determine that our length of 0x8000000 bytes is 128 megabytes.
Link it up
Using qemu and dtc, we’ve successfully discovered where the RAM lives and how long it extends in our virt virtual machine. We also know that gcc is linking a default crt0 that isn’t setting up our stack the way we need it to. But what exactly do we do with this information, and how does it get us any closer to getting a running, debuggable program?
Well, since the default crt0 isn’t doing what we need it to, we have one obvious choice: writing our own, and then linking it with the object file created from compiling our simple addition program. Our crt0 will need to know where the top of the stack starts in order to properly initialize it. We could hardcode this value to 0x80000000 directly in our crt0, but that isn’t a very maintainable solution. What happens when we want to use a different qemu-lated CPU, such as the sifive_e, that has different memory properties?
Fortunately for us, we are far from the first to ask this question, and a good solution exists. GNU’s linking program, ld, provides a way for us to define a symbol which would be accessible from our crt0. We can use this, among other functions provided by ld, to create a __stack_top symbol definition that is reasonably flexible across multiple different CPUs.
Rather than writing our own linker file from scratch, it is going to make more sense to take the default linker script that ld uses and modify it slightly to expose any additional symbols we want. What is a linker script, you might be wondering? This snippet from a now dead link summarizes it well:
The main purpose of the linker script is to describe how the sections in the input files should be mapped into the output file, and to control the memory layout of the output file.
Knowing this, let’s copy the default linker script riscv64-unknown-elf-ld uses into a new file:
# In the `riscv-from-scratch/work` directory...
# Copy the default linker script into riscv64-virt.ld
riscv64-unknown-elf-ld --verbose > riscv64-virt.ld
There’s a lot of interesting information in this file, much more than we can review in this post. The --verbose output of the command we just ran includes information about the version number of ld, supported architectures, and more. This is all good to know, but not valid linker script syntax, so let’s remove it. Using the text editor of your choice, edit riscv64-virt.ld and remove everything above and including the line of equals signs.
vim riscv64-virt.ld

# Remove everything above and including the ============ line
GNU ld (GNU Binutils) 2.32
  Supported emulations:
   elf64lriscv
   elf32lriscv
using internal linker script:
==================================================
/* Script for -z combreloc: combine and sort reloc sections */
/* Copyright (C) 2014-2019 Free Software Foundation, Inc.
   Copying and distribution of this script, with or without modification,
   are permitted in any medium without royalty provided the copyright
   notice and this notice are preserved.  */
OUTPUT_FORMAT("elf64-littleriscv", "elf64-littleriscv",
	      "elf64-littleriscv")
...rest of the linker script...
With that out of the way, the first thing we’ll want to do is make use of the MEMORY command to tell the linker we want to take manual control of the memory layout. This paves the way for us to be able to correctly define where __stack_top should be. Search for the line that starts with OUTPUT_ARCH(riscv), which should be towards the top of the file, and below it add our MEMORY command:
OUTPUT_ARCH(riscv)
/* >>> Our addition. <<< */
MEMORY
{
   /* qemu-system-risc64 virt machine */
   RAM (rwx)  : ORIGIN = 0x80000000, LENGTH = 128M
}
/* >>> End of our addition. <<< */
ENTRY(_start)
With this, we’ve created a block of memory called RAM that is readable (r), writable (w), and capable of containing executable code (x).
Great, so we’ve defined a memory layout to match the specifications of our virt RISC-V machine. But this RAM memory block isn’t much use unless we actually do something with it. We want our stack to live in RAM, so let’s use this RAM definition to create __stack_top.
Defining this symbol is easy. Open the custom linker script (riscv64-virt.ld) back up in the editor of your choice and make the following addition:
SECTIONS
{
  /* Read-only sections, merged into text segment: */
  PROVIDE (__executable_start = SEGMENT_START("text-segment", 0x10000));
  . = SEGMENT_START("text-segment", 0x10000) + SIZEOF_HEADERS;
  /* >>> Our addition. <<< */
  PROVIDE(__stack_top = ORIGIN(RAM) + LENGTH(RAM));
  /* >>> End of our addition. <<< */
  .interp         : { *(.interp) }
  .note.gnu.build-id  : { *(.note.gnu.build-id) }
As you can see, we use the PROVIDE command to define a symbol called __stack_top. __stack_top will be accessible from any program linked with this script (assuming the program itself does not also define something named __stack_top). We set the value of __stack_top to be ORIGIN(RAM), which we know is 0x80000000, plus LENGTH(RAM), which we know is 128 megabytes (0x8000000 bytes). This means our __stack_top is set to 0x88000000.
Stop! Hammertime Runtime!
We finally have all we need to create a custom C runtime that works for us, so let’s get started. Create a file called crt0.s in the riscv-from-scratch/work/ directory and insert the following:
.section .init, "ax"
.global _start
_start:
    .cfi_startproc
    .cfi_undefined ra
    .option push
    .option norelax
    la gp, __global_pointer$
    .option pop
    la sp, __stack_top
    add s0, sp, zero
    jal zero, main
    .cfi_endproc
    .end
The first thing you may notice is that there are a lot of lines that begin with a .. This is an assembly file, meaning the program that will be looking at this is the assembler, which in the GNU world is the as executable. The lines that begin with .s are called assembler directives, which provide information to the assembler rather than acting as executable code like our RISC-V assembly instructions, such as jal and add.
With this knowledge in mind, let’s run through this file line-by-line. We’ll be working with various RISC-V standard registers, so check out this table for a good overview of each of them and their purpose.
.section .init, "ax"Referencing the GNU ‘as’ manual, this line tells the assembler that we want the following code to go into a section named .init that is allocatable and executable. The .init section is another commonly followed convention for running your code within the confines of an operating system. We’re running on bare metal with no OS, so this may not be totally necessary in our case, but it’s good practice regardless.
.global _start
_start:
.global is important because it makes the symbol following it available to ld. Without this, linking would fail because we told it via the ENTRY(_start) command in our linker script that it should look for the _start symbol when establishing the entry point to our executable. _start: tells the assembler we are beginning the definition of a symbol called _start.
_start:
  .cfi_startproc
  .cfi_undefined ra
  ...other stuff...
  .cfi_endproc
These .cfi directives inform tools, such as the assembler or exception unwinder, about the structure of the frame and how to unwind it. .cfi_startproc and .cfi_endproc signal the start and end of a function, and .cfi_undefined ra tells the assembler that register ra should not be restored to whatever value it contained before _start ran.
.option push
.option norelax
la gp, __global_pointer$
.option pop
These .option directives modify assembler behavior inline with assembly code, which is useful when particular instruction sequences must be assembled with a specific set of options. This link describes in good detail why this is important for the code segment above, so I’ll quote it directly:
…since we relax addressing sequences to shorter GP-relative sequences when possible, the initial load of GP must not be relaxed and should be emitted as something like:
.option push
.option norelax
la gp, __global_pointer$
.option pop
in order to produce, after linker relaxation, the expected:
auipc gp, %pcrel_hi(__global_pointer$)
addi gp, gp, %pcrel_lo(__global_pointer$)
instead of just:
addi gp, gp, 0And now for the last portion of our crt0.s:
_start:
  ...other stuff...
  la sp, __stack_top
  add s0, sp, zero
  jal zero, main
  .cfi_endproc
  .end
Here we finally make use the __stack_top symbol we worked so tirelessly to create. la, or the “load address” pseudoinstruction (which will be further explained below), loads the value of __stack_top into the sp (stack pointer) register, setting it up to be used for the remainder of our program.
Next, add s0, sp, zero adds together the value of the sp register with the value of the zero register (which is actually the x0 register, hardwired to 0), and finally places it into the s0 register. s0 is a special register in a few ways. First, it is what is known as a “saved register” meaning it is preserved across function calls. Second, s0 sometimes acts as the frame pointer, which enables each function invocation to maintain it’s own little space on the stack for storing parameters passed into that function. How function calls work with the stack and frame pointers is a very interesting subject and could easily be a full-length post on it’s own, but for now just know that initializing our frame pointer s0 is an important task for our runtime.
The next instruction we see is jal zero, main. jal stands for “jump and link”, and expects operands in the form of jal rd (destination register), offset_address. Functionally, jal writes the value of the next instruction (the pc register plus four) to the rd, and then sets the pc register to the current value of pc plus the sign-extended offset address, effectively “calling” that address.
As mentioned above, x0 is hardwired to the literal value of 0, and writes to it have no effect. With this in mind, you may think it’s odd that we’re using the zero register, which RISC-V assemblers interpret as the x0 register, as our destination register, since this effectively creates an unconditional and side-effect free jump to offset_address. Why do it this way, you may wonder…don’t other ISAs have an explicit unconditional jump instruction?
This odd jal zero, offset_address pattern is actually a clever optimization enabled by the dedication of one whole register to a hard-wired zero. Each supported instruction means a larger, and therefore more expensive, processor, so the simpler the ISA the better. Rather than polluting the instruction space with both jal and unconditional jump instructions, the RISC-V ISA only calls for jal, but through jal zero, main supports unconditional jumps.
There are many, many similar optimizations in RISC-V, most taking the form of what are known as pseudoinstructions. Pseudoinstructions are instructions that assemblers know how to translate to other actual hardware-implemented instructions. For example, there is an unconditional jump pseudoinstruction j offset_address, which RISC-V assemblers translate to jal zero, offset_address. For a full list of officially supported pseudoinstructions, search for pseudoinstruction here in v2.2 of the RISC-V spec.
_start:
  ...other stuff...
  jal zero, main
  .cfi_endproc
  .end
Our very last line is an assembler directive, .end, which simply marks the end of the assembly file.
Debugging, but for real this time
To recap, we’ve worked through many problems in our quest of debugging a simple C program on a RISC-V processor. We first used qemu and dtc to find where our memory was located in the virt virtual RISC-V machine. We then used this information to take manual control of the memory layout in our customized version of the default riscv64-unknown-elf-ld linker script, which then enabled us to accurately define a __stack_top symbol. We finished by using this symbol in our own custom crt0.s that set up our stack and global pointers and finally called the main function. Let’s make use of all this work to complete our original goal of debugging our simple C program in GDB.
As a reminder, here was our add.c program:
int main() {
    int a = 4;
    int b = 12;
    while (1) {
        int c = a + b;
    }
    return 0;
}
And now to compile and link:
riscv64-unknown-elf-gcc -g -ffreestanding -O0 -Wl,--gc-sections \
    -nostartfiles -nostdlib -nodefaultlibs -Wl,-T,riscv64-virt.ld \
    crt0.s add.c
You’ll notice we have specified a lot more flags than we did last time, so let’s walk through all the ones we didn’t cover in the first section.
-ffreestanding tells the compiler that the standard library may not exist, and therefore not to make assumptions that it will be there. This option isn’t necessary when running your application in a hosted environment (within an OS), but we aren’t doing that, so it’s important to tell the compiler that information.
-Wl is a comma-separated list of flags to pass on to the linker (ld). --gc-sections stands for “garbage collect sections”, and tells ld to remove unused sections post-link. -nostartfiles, -nostdlib, and -nodefaultlibs respectively tell the linker not to link in any standard system startup files (such as the default crt0), any standard system stdlib implementation, or any standard system default linkable libraries. We are providing our own crt0 and linker script, so it’s important to pass these flags to inform the compiler we don’t want any of these defaults to avoid conflict with our custom setup.
-T allows you to specify the path to your linker script, which in our case is simply riscv64-virt.ld. Finally, we specify the files we wish to compile, assemble, and link: crt0.s and add.c. As with before, this all results in a fully-fledged and ready-to-run executable called a.out.
We’ll now start our shiny new executable in qemu:
# -S freezes execution of our executable (-kernel) until we explicitly tell
# it to start with a 'continue' or 'c' from our gdb client
qemu-system-riscv64 -machine virt -m 128M -gdb tcp::1234 -S -kernel a.out
And then start gdb, making sure to load the debug symbols for a.out by specifying it as our last argument:
riscv64-unknown-elf-gdb --tui a.out

GNU gdb (GDB) 8.2.90.20190228-git
Copyright (C) 2019 Free Software Foundation, Inc.
License GPLv3+: GNU GPL version 3 or later <http://gnu.org/licenses/gpl.html>
This is free software: you are free to change and redistribute it.
There is NO WARRANTY, to the extent permitted by law.
Type "show copying" and "show warranty" for details.
This GDB was configured as "--host=x86_64-apple-darwin17.7.0 --target=riscv64-unknown-elf".
Type "show configuration" for configuration details.
For bug reporting instructions, please see:
<http://www.gnu.org/software/gdb/bugs/>.
Find the GDB manual and other documentation resources online at:
    <http://www.gnu.org/software/gdb/documentation/>.

For help, type "help".
Type "apropos word" to search for commands related to "word"...
Reading symbols from a.out...
(gdb)
Next, we’ll connect our gdb client to the gdb server we started as part of our qemu command:
(gdb) target remote :1234                                                                             │
Remote debugging using :1234
Set a breakpoint in main:
(gdb) b main
Breakpoint 1 at 0x8000001e: file add.c, line 2.
And start execution of the program:
(gdb) c
Continuing.

Breakpoint 1, main () at add.c:2
You’ll notice from the above output that we have successfully hit a breakpoint on line 2! Our text interface also shows this via the B+> gutter annotation, and we finally have a proper line L and PC: value - L2 and PC: 0x8000001e. If you’ve been following along, yours might look something like this:
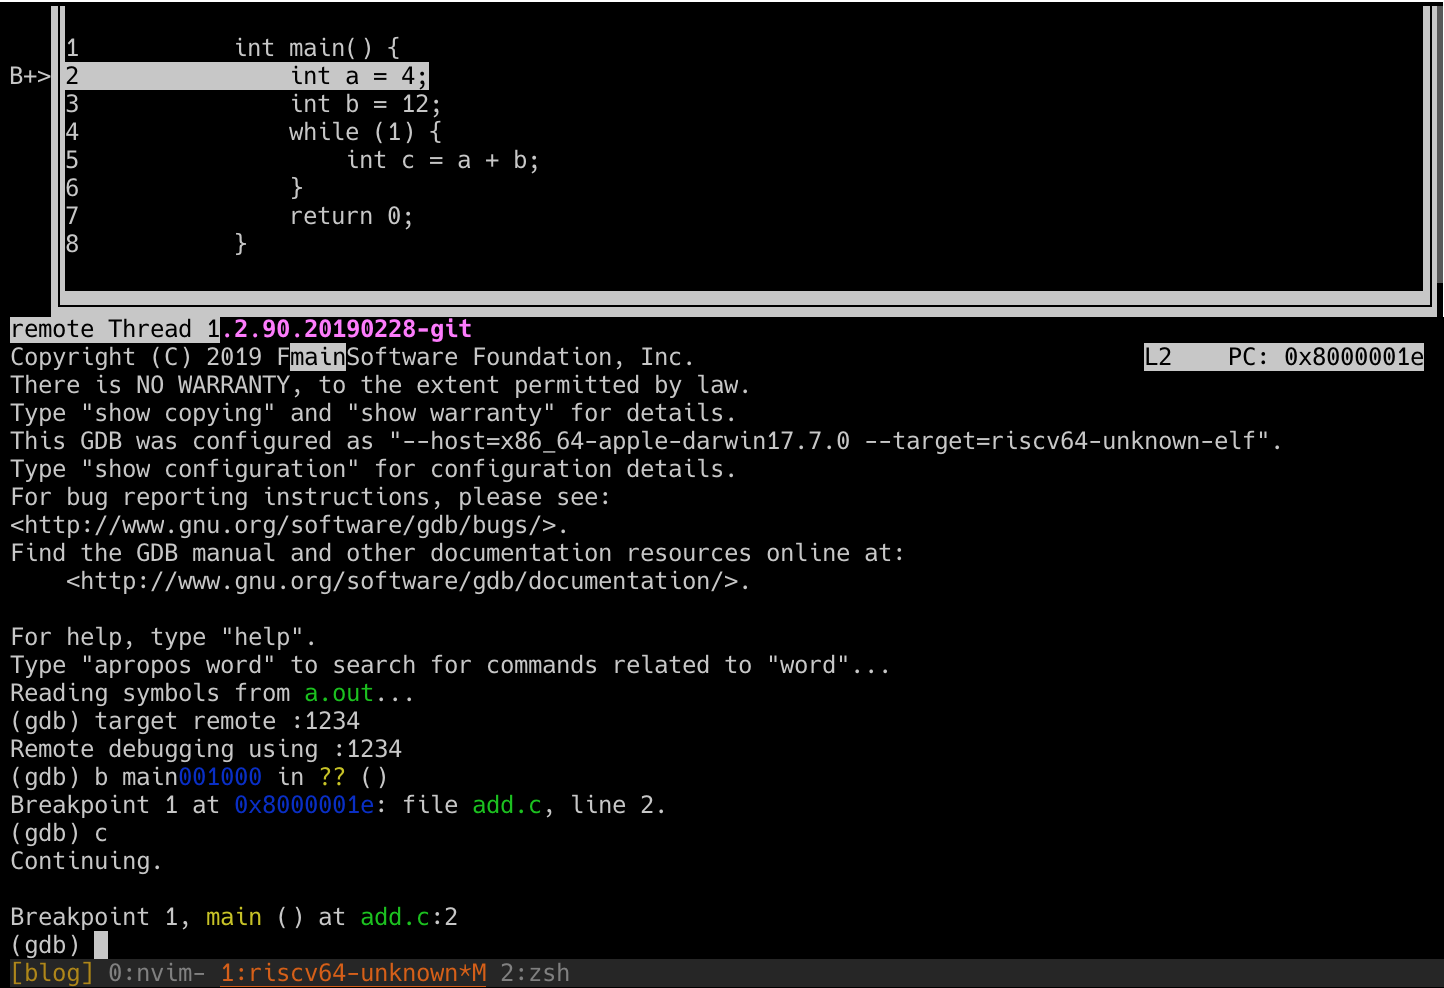
From here we can use gdb as normal - s to step to the next instruction, info all-registers to inspect the values inside our registers as our program executes, so on and so forth. Experiment to your hearts content…we certainly worked hard enough to get here!
What’s next
In our next post, we’ll continue to build on our knowledge of RISC-V assembly by beginning implementation of a driver for the UART onboard the virt QEMU machine. Expect to learn about what a UART is and how it works, additional devicetree properties, the basic building blocks required to implement an NS16550A-compatible UART driver, and more.
Sound interesting? This post has been released - click here to check it out. If you have any questions, comments, or corrections, feel free to open up an issue or leave a comment below via utterances.
Thanks for reading!
Extra credit
If you enjoyed this post and want event more, Matt Godbolt gave a presentation titled “The Bits Between the Bits: How We Get to main()” at CppCon2018 that approaches this subject from a few different angles than we took here in this post. If you’ve worked through the entirety of this post you will definitely recognize some of the things he covers. It’s a good talk, so check it out!